What Orange County's Housing Market Reveals About Sellers Who Walk Away - Without Really Leaving
National headlines keep repeating the same story: more homeowners are pulling their homes off the market instead of accepting lower offers. Redfin reported that 5.8% of all U.S. listings were delisted in April 2026, tying December 2025 for the highest share since March 2020 — and that Florida and Texas metros led the nation in delistings.
I wanted to know what that actually looks like here, in Orange County. Not the percentage - the people. When a seller "delists," what are they actually doing? Giving up? Waiting it out? Trying something else entirely?
The headlines don't say. So I pulled the data myself, then went one step further: I traced what happened to 83 real sellers after they hit pause. What I found should change how you think about pulling a listing.
The Big Picture: More Sellers Are Leaving Without Selling
To measure this locally, I built a simple metric I call the Market Exit Ratio - not a standardized industry term, just a calculation I use to compare how many listings leave the market (expired, withdrawn, or otherwise) against how many actually close, in the same window each year. It's not a perfect measure, but it's a useful gut check on how often sellers walk away from the closing table.
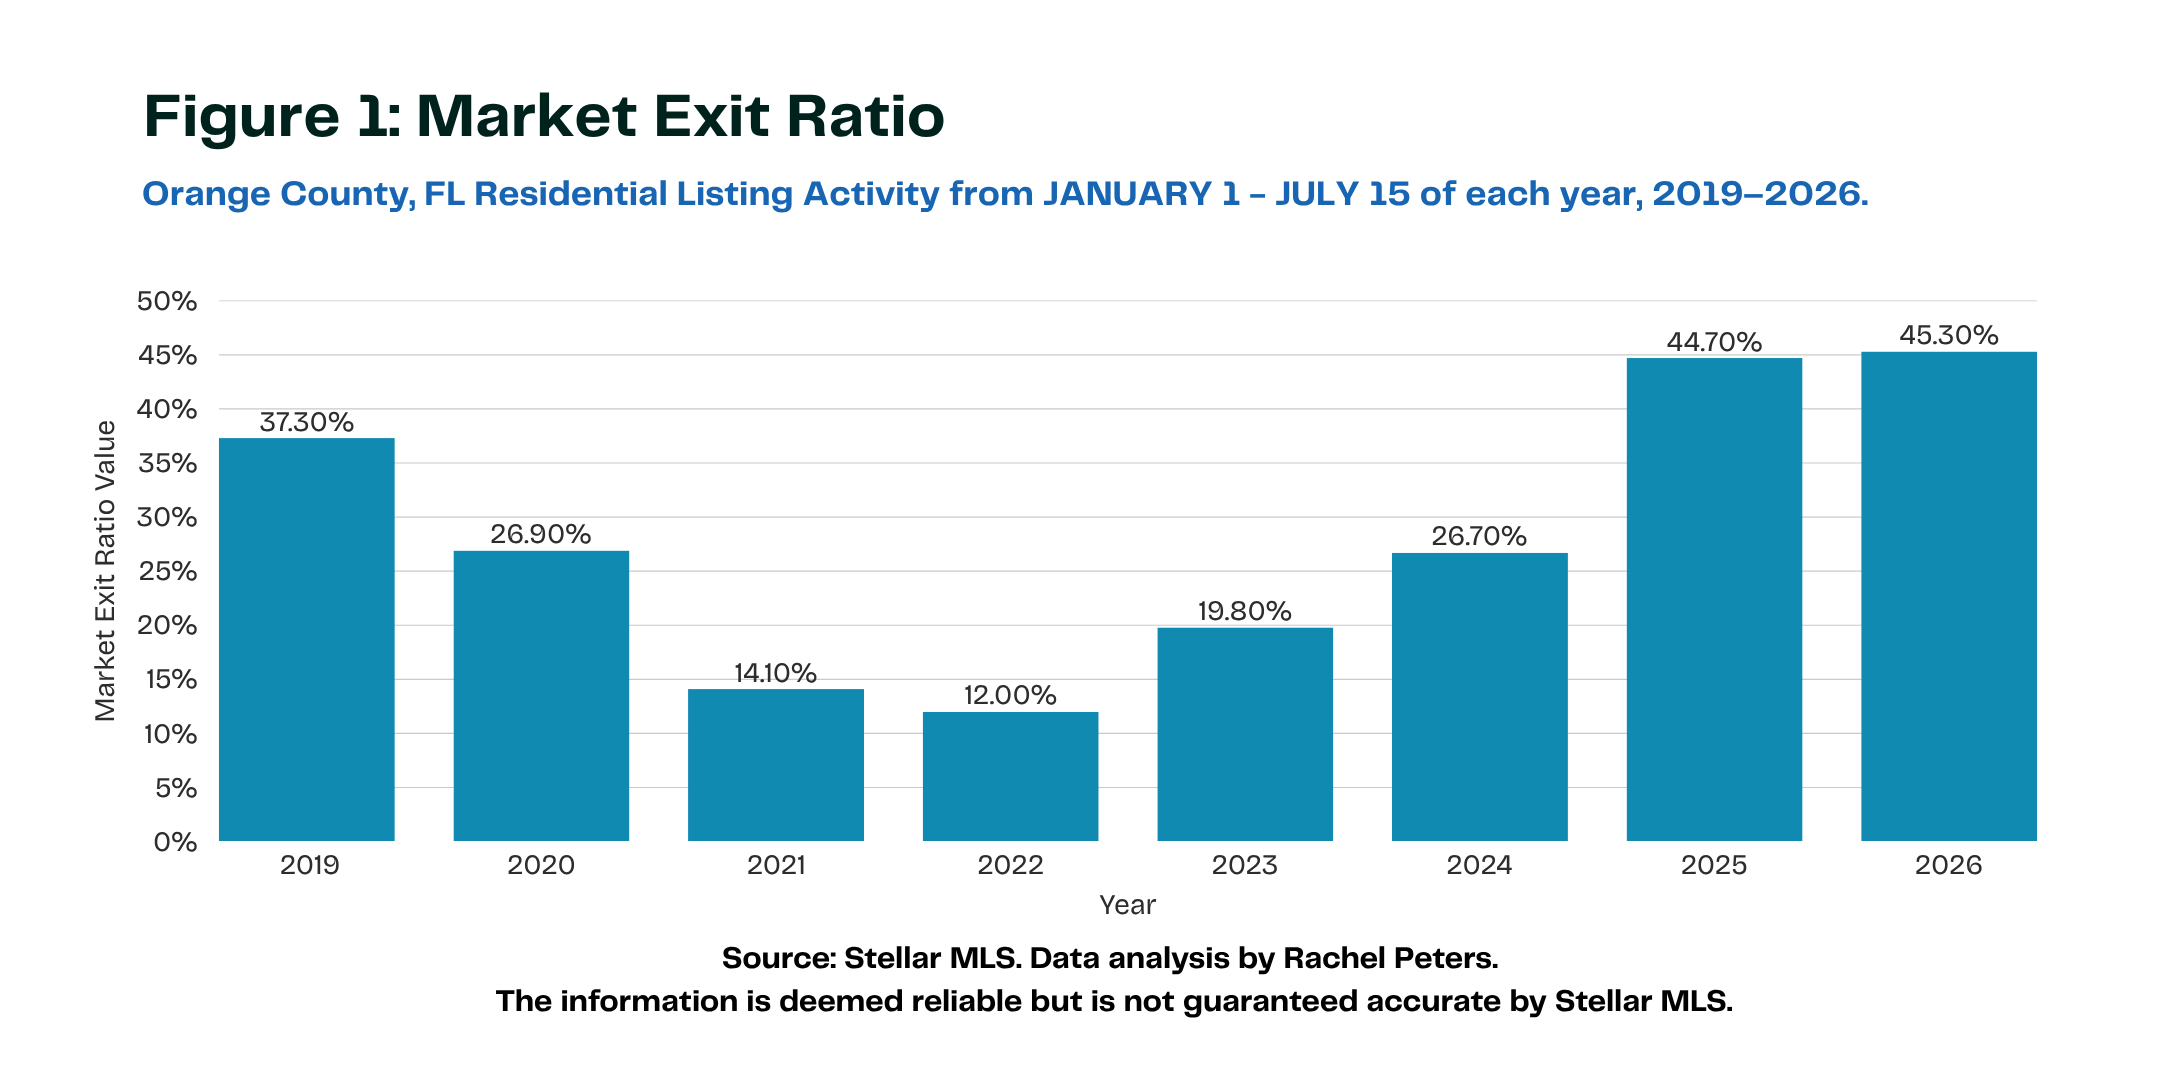
Figure 1: Market Exit Ratio Orange County, FL, January 1 – July 15 of each year, 2019–2026
During the tight market of 2021 and 2022, this ratio sat around 12–14%. Demand was strong, inventory was scarce, and most sellers who listed found a buyer. By 2025, it had climbed to 44.7%. Through the first half of 2026, it's at 45.3%. Roughly one in every two sellers who list a home in Orange County right now is leaving the market without a sale.
That number confirms the national narrative. It doesn't explain it - so I broke it down further.
The Real Story Isn't Leaving. It's Pausing.
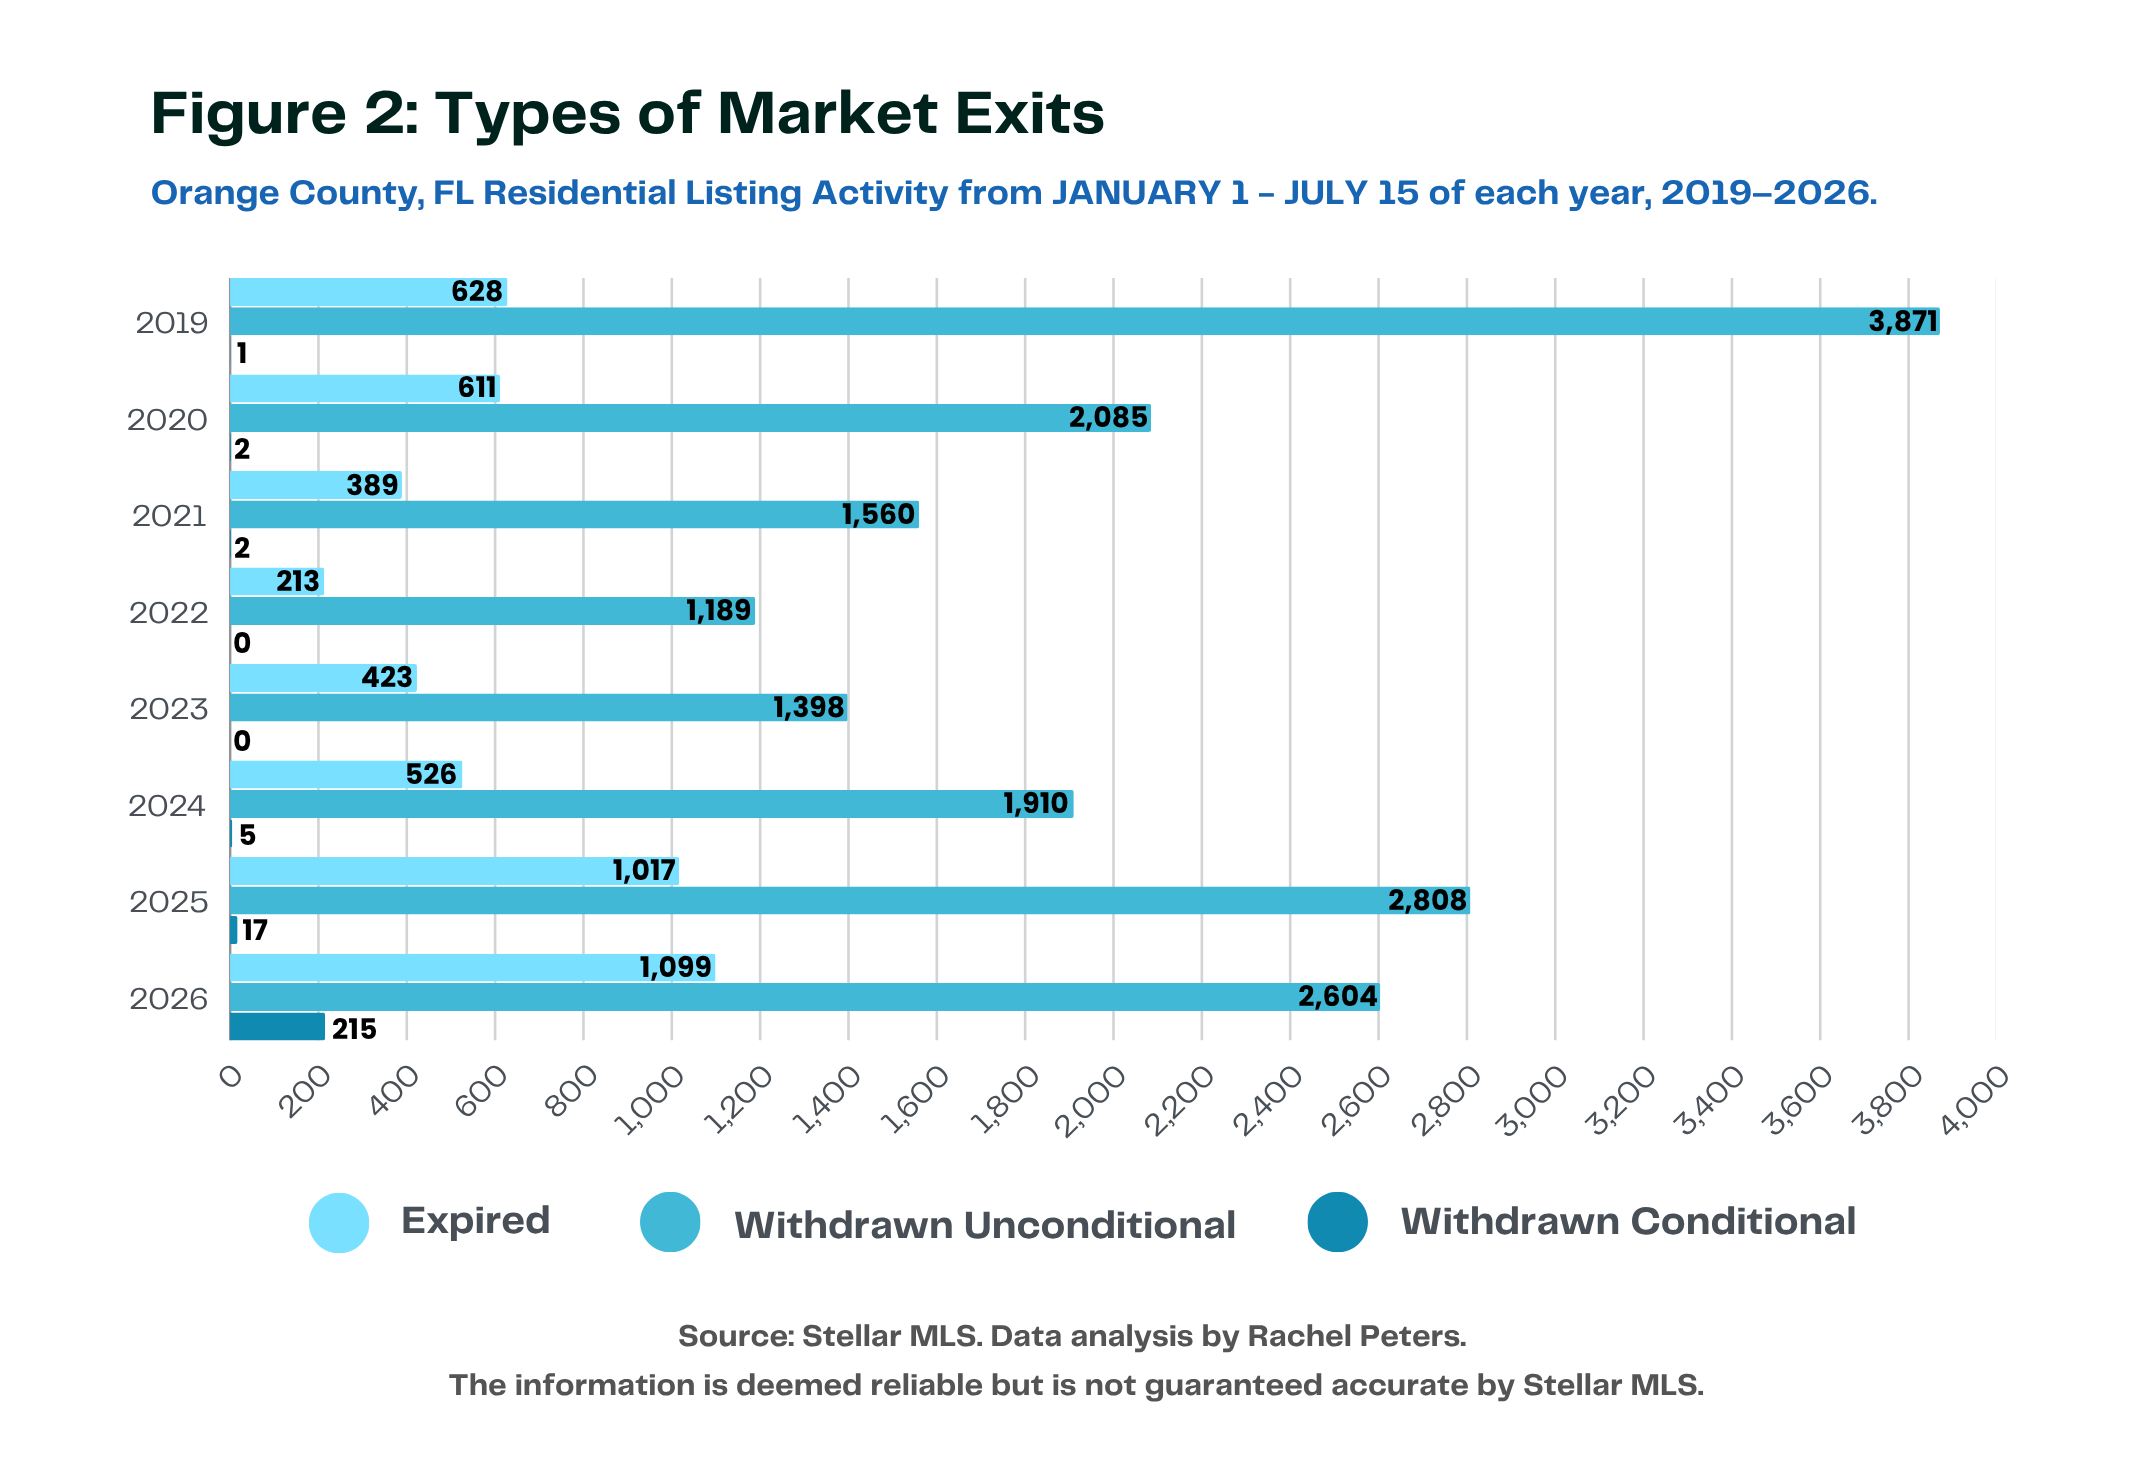
Figure 2: Types of Market Exits Orange County, FL, January 1 – July 15 of each year, 2019–2026
Sellers exit a listing three ways: it expires, they withdraw it unconditionally (a full exit), or they go Withdrawn Conditional - pulling the home off active marketing while keeping their listing agreement in place. Think of it as a pause button rather than an off switch.
Expired listings rose in 2025 and 2026. Withdrawn Unconditional listings stayed elevated. But neither of those categories tells the real story of this market shift.
Withdrawn Conditional did. From 2019 through 2024, it was almost nonexistent, just 5 listings in that window in 2024. In 2025, that number jumped to 17. In 2026, it hit 215.
That's not a trend. That's a behavior shift. Sellers weren't giving up on selling - they were pressing pause, keeping the door open, and waiting for something to change. The question was: waiting for what? And how often does the wait actually pay off?
What Happened to the 83 Sellers Who Paused
A Withdrawn Conditional status doesn't tell you what a seller does next - only that they stepped back without fully walking away. To find out what actually happens after the pause, I manually reviewed the full listing history of every Orange County property that entered Withdrawn Conditional status during the 2025 calendar year: 83 properties in total.
(Note on scope: Figures 1 and 2 use a consistent January 1–July 15 window each year for clean year-over-year comparison. This review uses the full 2025 calendar year instead, because outcomes take time to materialize — a listing paused in June 2026 hasn't had the runway yet to show whether the seller relisted, leased, or sold. The full 2025 year gave these 83 properties 7 to 19 months to reach an outcome, tracked through July 15, 2026.)
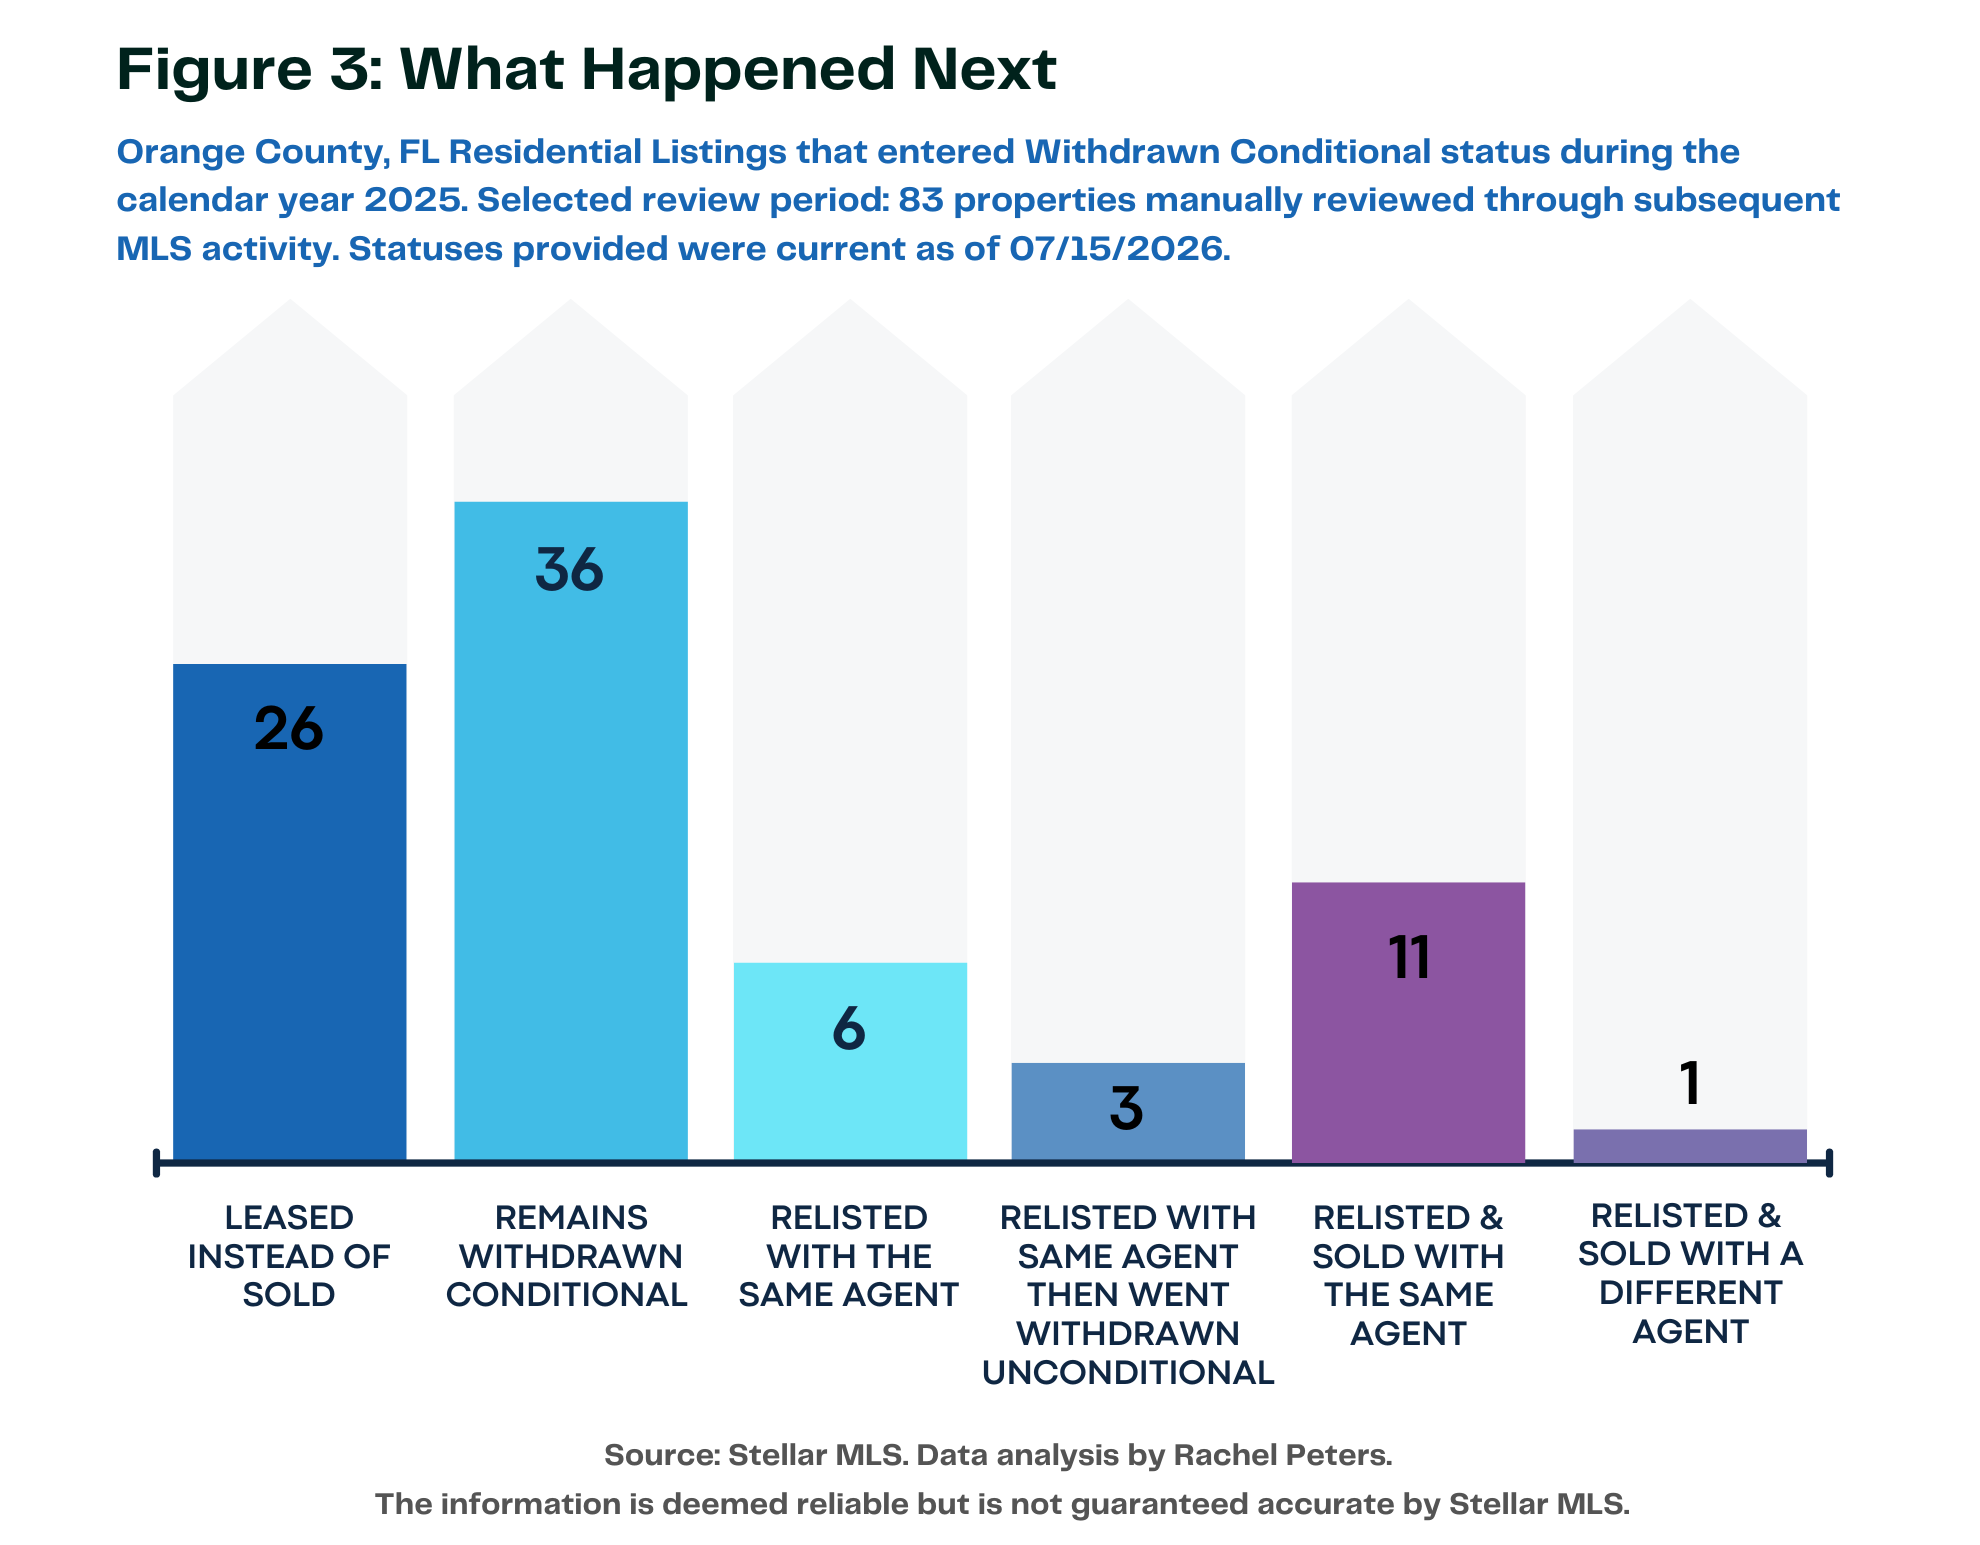
Figure 3: What Happened Next
Here's what I found:
- 36 properties (43%) are still sitting in Withdrawn Conditional status, more than a year later, with no resolution.
- 26 properties (31%) were leased instead of sold. The owner became a landlord.
- 21 properties (25%) went back on the market. Of those, 12 sold — 11 with the same agent, 1 with a different one. 6 are back on the market and still unsold. 3 relisted, didn't sell, and were withdrawn again.
Put simply: of the 83 sellers who paused their listing, only 12 - about 1 in 7 - went on to actually sell.
Only 1 in 7 sellers who paused their listing went on to sell.
Of 83 Orange County properties withdrawn conditional in 2025, just 12 resulted in a completed sale. -Orange County, FL listing data, Stellar MLS
That's the number that should reframe how you think about "just taking a break" from the market. Pausing isn't a neutral holding pattern. For most sellers in this sample, it was either the start of a long stall, a pivot to becoming a landlord, or a second attempt that also didn't close.
What This Means If You're Considering a Pause
There's no universally "right" move in this market - buyer and seller expectations are misaligned right now, and that mismatch is exactly why more listings are exiting without selling. But the data suggests that "pause and revisit later" isn't the low-risk, no-cost option it might feel like. For most of the sellers in this sample, pausing didn't lead back to a sale - it led to limbo, a lease, or a second attempt that also stalled.
Your financial goals, timeline, and risk tolerance are specific to you, and they should drive the decision - not a headline, and not a single data point either. But if you're weighing whether to pause, relist, lease, or hold, it's worth looking at what actually happened to sellers who chose each path before you choose yours.
If your listing has recently expired, been withdrawn, or you're considering pulling it, I'd be glad to walk through what your specific options actually look like - no pressure, no obligation. [Schedule a free listing review].
That evaluation doesn't have to happen alone. If you're weighing whether to list, relist, lease, or wait, let's look at your numbers together. Book a strategy call and I'll walk you through what the current Orange County data means for your specific property.
Methodology: Data sourced from Stellar MLS, Orange County, FL residential listings. Figures 1 and 2 reflect January 1–July 15 activity for each year 2019–2026, for consistent year-over-year comparison. Figure 3 reflects the full 2025 calendar year, with outcomes tracked through July 15, 2026, to allow sufficient time for resolution. The information is deemed reliable but not guaranteed accurate by Stellar MLS.
Check out this article next